


HOW TO INCREASE AND MONETIZE 14,000 TWITTER FOLLOWERS IN AN ECOMMERCE

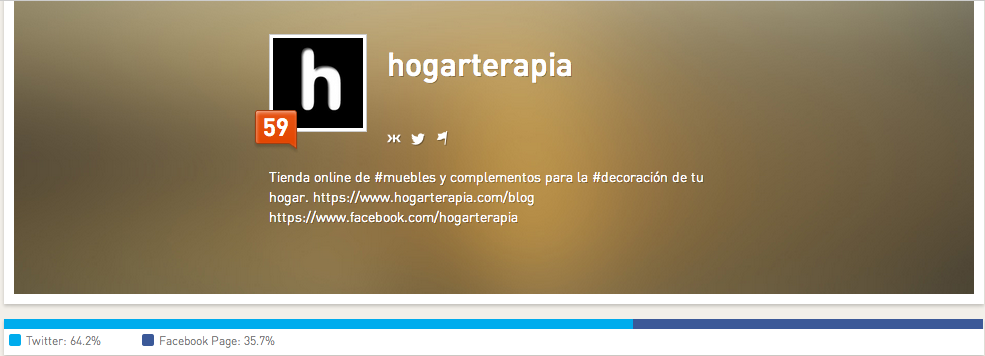
The following article is a real case of one of our clients @Hogarterapia, whom we thank for authorizing us to scrutinize their statistics and illustrate the strategy of their brand on Twitter. It is an ecommerce that sells furniture, using an inbound marketing strategy whose pillar is the connection: Ecommerce + blog + Twitter, with Twitter being the main source of traffic to the site, ahead of Google.
Let's start with the strategy.
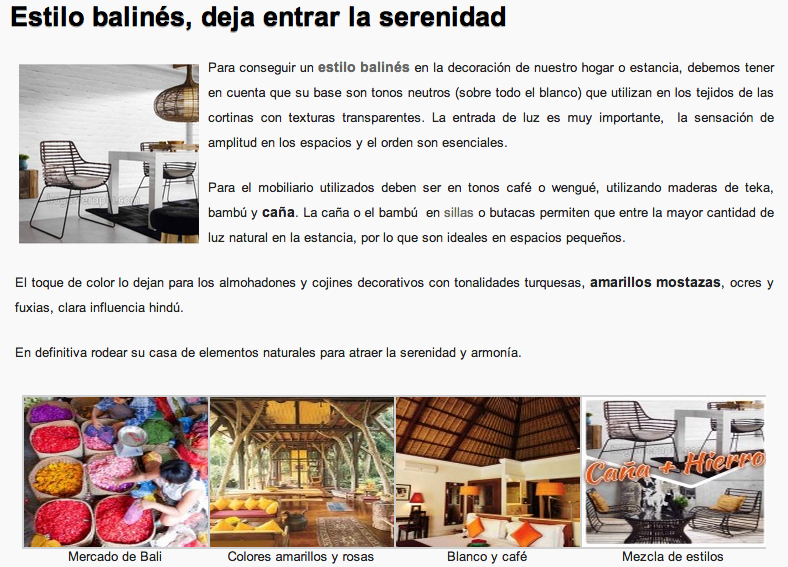
This online store, Hogarterapia.com, uses the sofa blog integrated in the domain, in which it indirectly sells its products and creates value for the user through decoration advice. Take as an example this excellent Tweet (direct and illustrative, which incites a call to action to see the post)
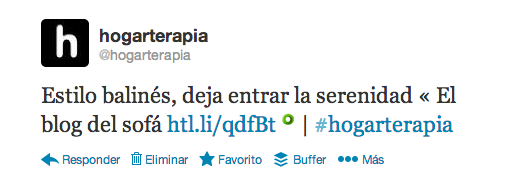
This Tweet takes us to a brief and concise article that provides value to the user explaining how to get a Balinese style in your home and its advantages. Clicking on the illustrative photo, takes us to the ecommerce product where the products are sold (indirect sale through the blog).
As we will see below, Twitter generates more than 1,000 monthly visits to the blog, surpassing the traffic that Google derives.
The article is documented with reports that measure the objectives of your Social Media Plan for Twitter, to finally draw conclusions and advice.
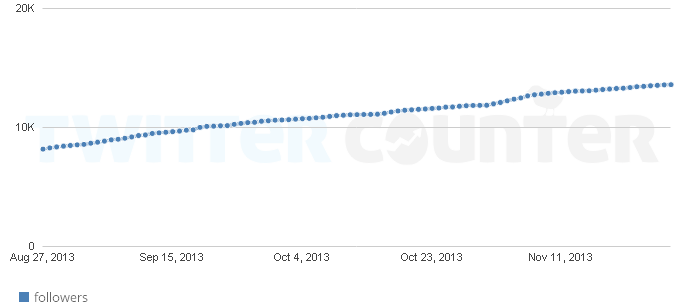
Let's see in 6 graphs, what has happened from February to November 2013, and how Twitter has been a catalyst in its strategy, going from 270 to 14,000 segmented and qualified followers.
1. Increase of Followers. Objective: to measure the increase in the number of monthly followers and their evolution.
Metric: Twittercounter.com/Hogarterapia: Nº followers and graph of increase of followers semiannual.
270 -> 14,250 Followers: 14,180 new Followers from February to November 2013. We will check later the segmentation and quality of these followers.
2. Ranking followers. Objective: Notoriety through the Ranking in the Benchmarking (study of the competition) and number of advanced positions. The benchmarking is updated monthly with the number of followers of the competitors that are still ahead, or the top 10, if we are in the top 10.
Ranking: 70 -> 3 Advance of 67 positions.
-
@Ikea_spain 38,363
-
@ElMueble 15,284
-
@Hogarterapia 14,250
-
@habitatvalencia 6075
-
@NewsHabitat 3622
-
@oficina_muebles 3196
-
@busk_design 3067
-
@aidima 2731
-
@MoblesBOOM 1910
-
@revistamuebles 1828
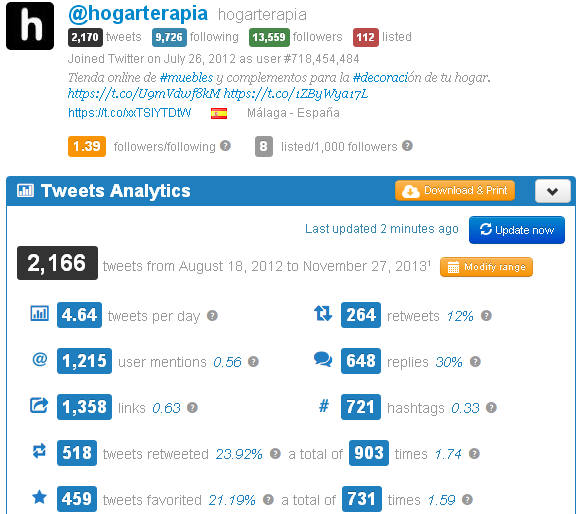
3. Influence. Objective: Measure influence and therefore the quality of the Followers. Valuation in Klout (main tool for measuring influence in social networks) and quarterly increment: http://klout.com/#/Hogarterapia: We also measure the influence with the number of Retweets, mentions, and lists to which we have added account
Klout: 42 -> 59. Increase of 17 points of influence from February to November.
Retweets: +200 Increase in 170 RTs.
Mentions: +400 Increase in 310 Mentions.
Lists: +100. Increase in 90 lists.
-
3. Influence. Objective: Measure influence with Twitonomy.com via: increase of received Retweets, sent tweets marked as favorites, and lists in which we have been included.
-
Nº monthly RTs and monthly increase. % of Retweeted Tweets 42 -> 459: + 417. Microamplification factor (average number of times a tweet is retweeted): 1.59
-
No. of tweets added to favorites and monthly increment. % of tweets marked as favorites Factor to mark tweets as favorites (average number of times a tweet is marked as favorite) 29 -> 459: + 430
-
Number of lists in which the profile has been included, and monthly increment. 10 -> 112 lists. + 102
-
No. of monthly tweets and increase over the previous month (to verify that the account is contributing content) This data must be taken directly from the twitter profile: 2.020 -> 2.170: +150.
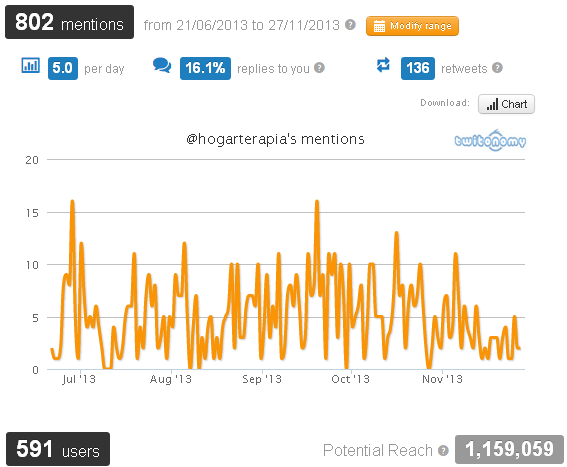
Number of mentions: 52 -> 802: + 750. 5 per day, compared to 0.3 per day in February.
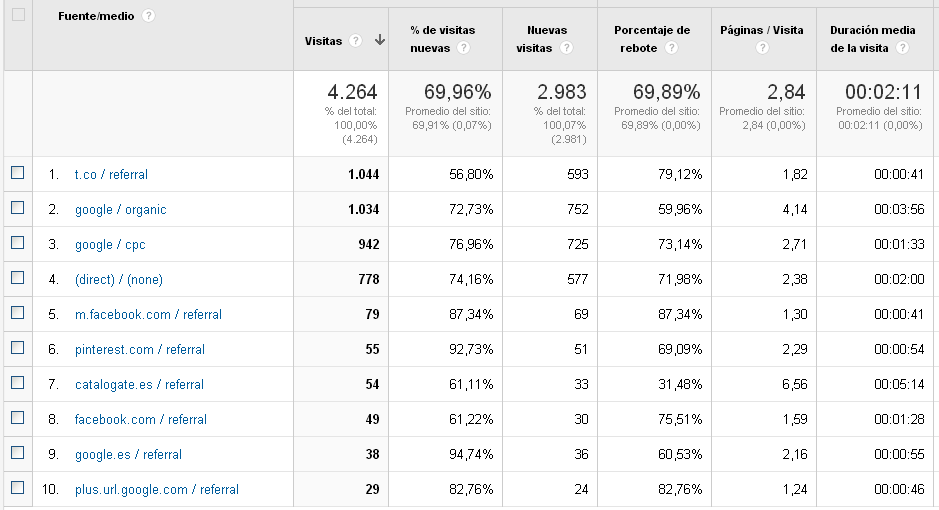
5. Source of traffic to the site. Measure the comparative ROI with other sources of traffic.
6. Traffic behavior from Twitter.
Conclusions
-
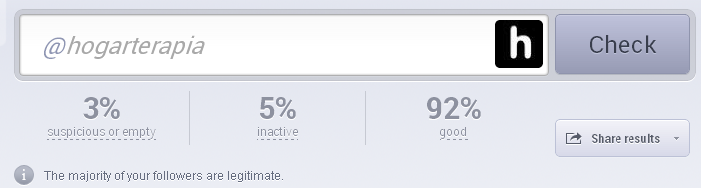
It has increased in 10 months to 14,000 followers, reaching the 3rd position in the ranking of companies related to furniture in Spain on Twitter. The engagement and influence (klout) has grown in the same proportion to the followers, being segmented users of their target, and maintaining the quality of the same without incurring in the increase of false (Fake) and inactive followers.
-
Twitter in less than a year has become the largest source of traffic to the website, surpassing even Google.
-
15% of the traffic that is generated from Twitter, goes directly to the home of the web. It is not traffic that enters the blog to share an article on Twitter, but Twitter users who want to know more about the company / brand (for their notoriety) and access their home, browsing the content of the site.
-
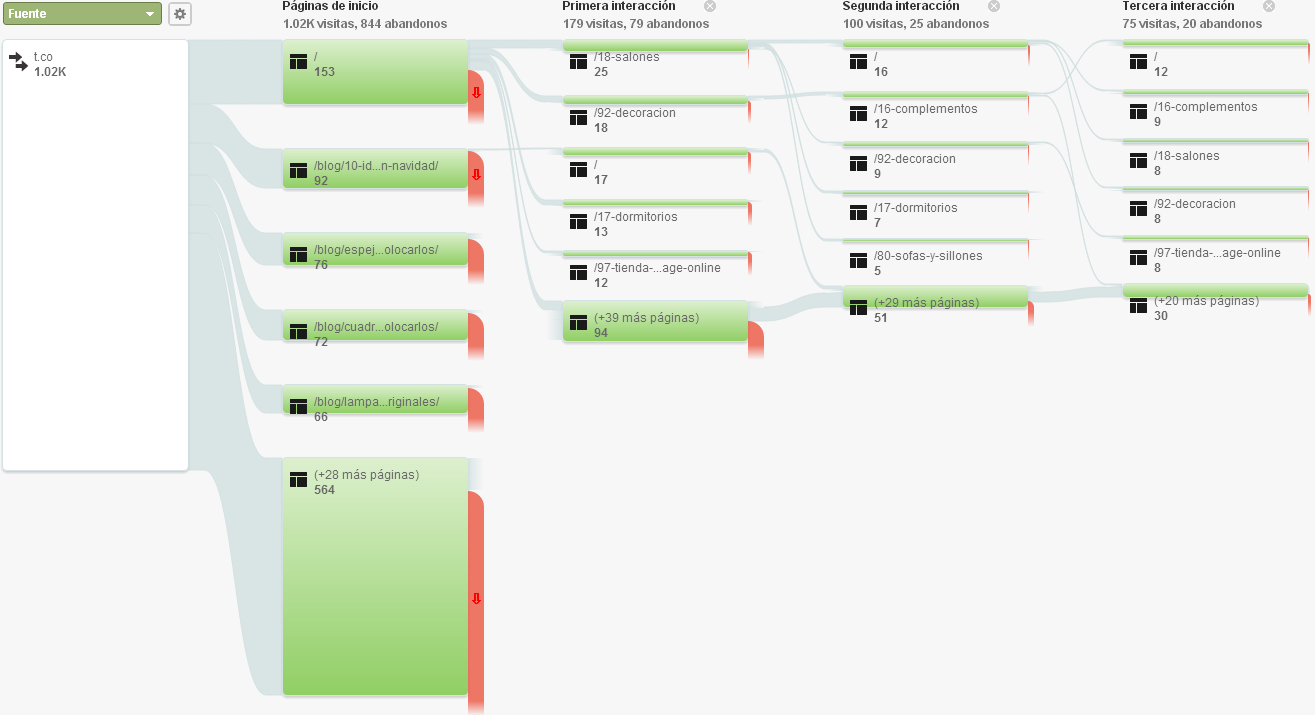
14% of the traffic that Twitter generates towards the blog, continues scrutinizing the web in up to 12 interactions. Highlights the fact that users who leave in each interaction are smaller than those who continue to navigate to the following pages.
Tips:
Publish more frequently in the Blog, generating articles of interest to the user (decoration tips ...) that indirectly sell the ecommerce products (links in the photographs used in the article). If the frequency of publication is increased, traffic to the blog is increased in the same proportion from Twitter. Post half-page post, direct, concise and practical, which in turn are micro-amplified in social networks.
Comments
Add new comment